The Wilks Formula Is Shitty
May 2018
In powerlifting, the Wilks Formula is by far the most popular standard of comparison for strength across different weight classes and genders. Recently, people have been complaining that this formula favors underrepresented classes (i.e. super-lights and super-heavies). I very much agree with this sentiment.
Below are the all-time top 10 Wilks coefficient scores for raw lifters based on performances at drug-tested meets. Extreme weight classes are highlighted in yellow.
| Name | Sex | Bodyweight (lb.) | Total (lb.) | Wilks |
|---|---|---|---|---|
| Ray Williams | M | 402 | 2,436 | 594 |
| Jesse Norris | M | 197 | 2,015 | 586 |
| Sergey Fedosienko | M | 129 | 1,477 | 585 |
| Jezza Uepa | M | 400 | 2,359 | 575 |
| Dennis Cornelius | M | 262 | 2,157 | 564 |
| Heather Connor | F | 97 | 876 | 559 |
| Kelly Branton | M | 363 | 2,249 | 557 |
| Taylor Atwood | M | 167 | 1,725 | 554 |
| Wei-Ling Chen | F | 103 | 898 | 552 |
| Kimberly Walford | F | 148 | 1,182 | 550 |
Source: OpenPowerlifting.org. Extract date 5/13/2018. Parameters: Raw, all classes, all drug-tested federations, all years, all sexes.
Note 1: In powerlifting, “raw” means lifting with minimal supportive equipment (no wraps). Various elastic suits and materials are permitted in “equipped” powerlifting divisions where much heavier weights are lifted.
Note 2: Weight classes range from 130–265+ lb for men and 104–185+ lb for women for the majority of meet performances in the table above.
The #1 lifter, Ray Williams, weighs 402 lb and the #3 lifter, Sergey Fedosienko, is 4'9". Both of these lifters compete in classes where there is very little competition, and they are #1 and #3 in the world. Coincidence? Or a broken formula?
Below is the distribution of bodyweights for competitive lifters at raw drug-tested meets. The bars for the six highlighted bodyweights above are very small; some are practically invisible.
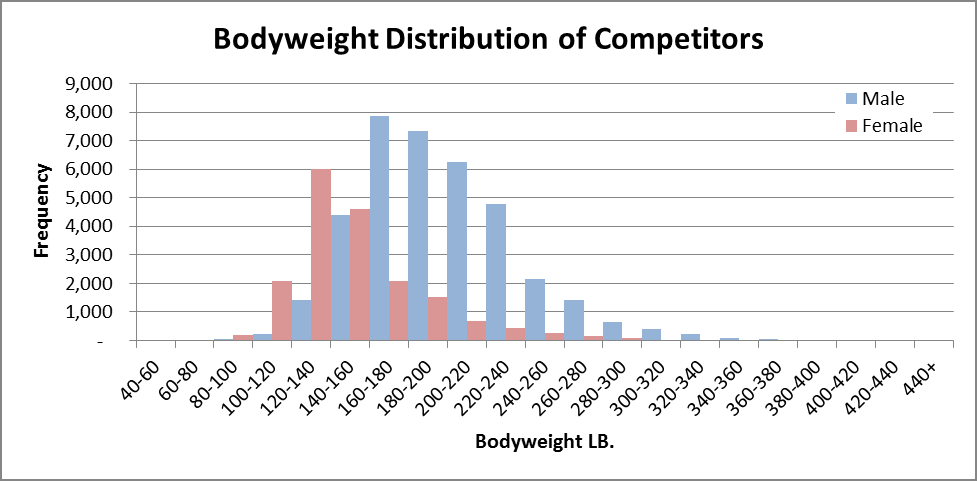
Source: OpenPowerlifting.org. Extract date 5/13/2018. Parameters: Raw, all classes, all drug-tested federations, all years, all sexes; only the best performance per lifter was taken.
Precisely speaking, there were only 15 male competitors in the 400–420 lb range where Ray Williams is. In contrast, the 160–180 lb weight range for men hosts the most competitors at 7,871. So a 400 lb man with the best performance out of 15 competitors is equivalent to a 160 lb man with the best performance out of 7,871 performances, according to Wilks. Ok...
Now I am actually a big fan of Ray Williams; he has a great personality and has done a lot for the sport, so I don’t mean to personally attack him. But, purely objectively, I want to present another angle of comparison.
There is a sport called strongman where the athletes are also very good at powerlifting, and the elite competitors also weigh over 400 lb. The 2017 World’s Strongest Man is Eddie Hall, who would easily beat Ray Williams in powerlifting. The 2016 and 2018 World’s Strongest Men are Brian Shaw and Hafthor Bjornsson respectively, and they would perform comparably to Ray Williams. So the top three competitors from a different sport would crush or tie the #1 powerlifter today.
Another problem with the Wilks Formula is that it gets pretty screwy once bodyweight gets over 600 lb. A 623 lb man lifting 100 lb will crush all-time records with a 1,400 Wilks. But he better not weigh in at 624 lb, because then he will score a Wilks of -282,679. This is due to the Wilks formula being a 5th degree polynomial.
Existing Alternatives
The simplest and crudest measure of relative strength is the bodyweight multiple (total/bodyweight), but bodyweight multiples are skewed toward lighter lifters to the point that they are much worse than Wilks. Lamar Gant deadlifted 661 lb at 132 lb for a 5x multiple, while Eddie Hall deadlifted 1,102 lb at 440 lb for a 2.5x multiple. No way in hell is Lamar Gant twice as good a deadlifter as Eddie.
More complex alternatives to the Wilks formula exist, but I find most of them not very good either. Formulas such as Glossbrenner coefficient, Reshel coefficient, NASA coefficient, Schwartz/Malone coefficient and Siff coefficient require you to look up your bodyweight on a large multi-page table, and then you still have to pull out a calculator to apply a multiplier. Not an “elegant” solution by any means.
Greg Nuckols wrote an excellent article with suggestions such as allometric scaling — a solution that a biologist would have come up with. But I think there is a better solution that a statistician would have come up with.
A Better Formula
Starting from the fundamentals, how do we identify the most impressive athlete in a discipline if the athletes don’t compete against each other? For example, how would we identify the best football player today when the positions are so different? If you had to find a mathematical solution from looking at the data, how would you do it?
I’ll give you a second to think, because I always thought that there is an obvious mathematical solution to this and I’m curious if you come up with the same method...
What I would do is figure out which athlete most outperformed their peers. Statistically speaking, I would figure out which athlete performed the most standard deviations above the mean within their group (i.e. compare z-scores). You may have a few objections:
- What if one athlete happens to be in a far less or more competitive group?
Well, in powerlifting there are thousands of people per weight class per year, so it’s statistically unlikely for the average among thousands of lifters to vary too much.
- So if two or more extraordinary athletes play in the same group, then the best athlete in that group cannot be considered the best overall?
Not true. We’re identifying standard deviations above the mean, not standard deviations above other elites.
On to the Math
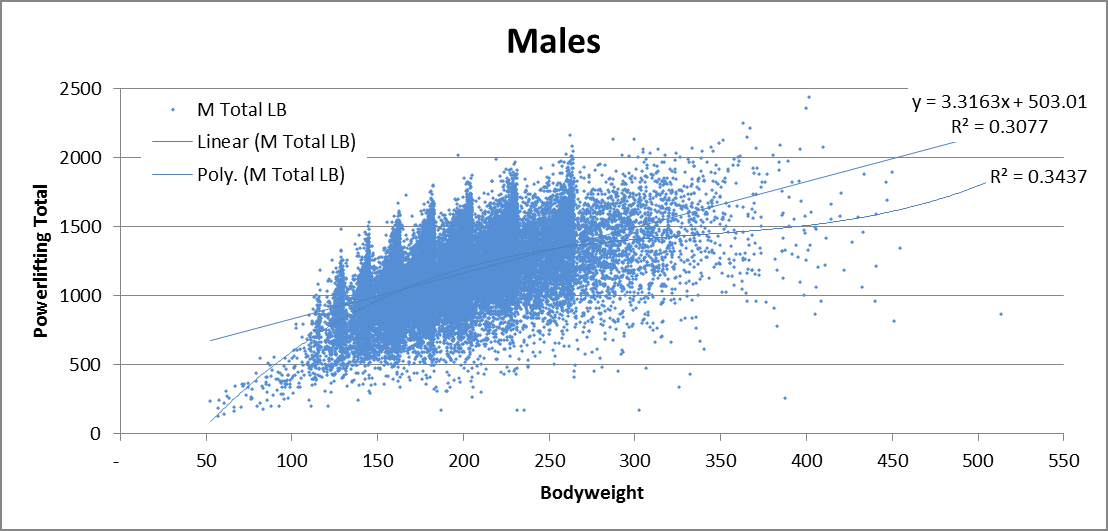
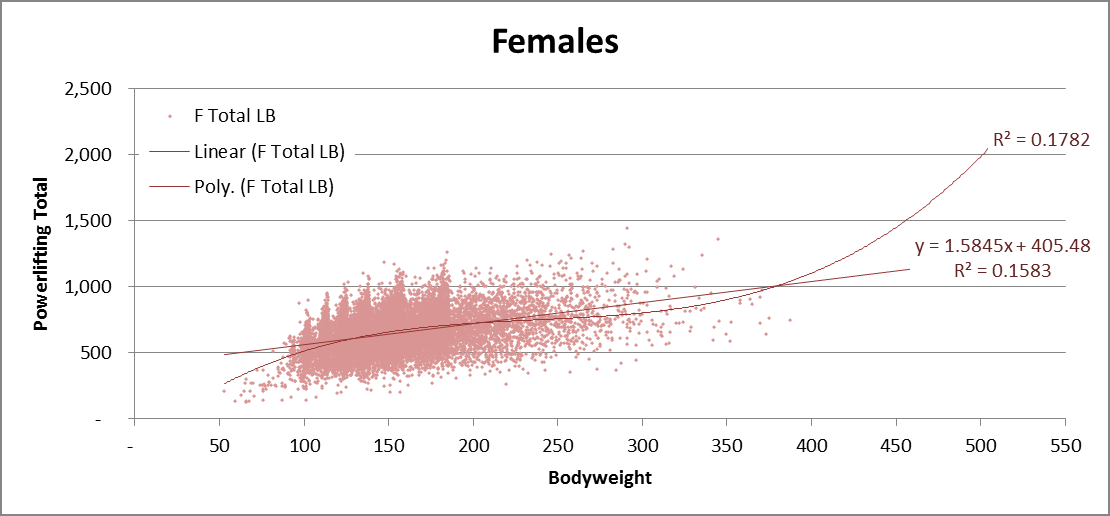
Let’s first plot powerlifting totals by bodyweight to get a sense of the shape of the distribution. I also performed a linear regression and 3rd degree fitted polynomial by gender. I tried higher degree polynomials too, but they looked ridiculous because the curve tried too hard to fit the super heavyweights even though there’s not much data there.
Source: OpenPowerlifting.org. Extract date 5/13/2018. Parameters: Raw, all classes, all drug-tested federations, all years, all sexes; only the best performance per lifter was taken.
Before I plotted the data, I was worried that the standard deviations at higher bodyweights were going to be much higher than at lower bodyweights because heavier people lift more weight, so there is more room for variance. Visually, this doesn’t appear to be the case, but just to be sure, I checked this statistically. The standard deviation for men above and below 200 lb bodyweight were 232 lb and 216 lb respectively. Close enough so I can just use the same standard deviation across all bodyweights.
Getting back to the scatter plots, is it better to use linear regression or the 3rd degree polynomial? The linear regression seems to fit the middle weights just as well as the polynomial, and fits the super-heavyweights better compared to the polynomial, especially for women but also for men. For super-lightweights, the polynomial seems to be doing better, but I looked at the raw data and most of the lightweights are children, so I would expect underperformance in my model there. Furthermore, lightweight classes inherently limit the amount of muscle mass an athlete can have, and muscle mass is very highly correlated to strength, so it makes sense that there are fewer outliers at the elite end. In fact, most athletes who have too much muscle to stay within their weight class usually just move up a weight class, leading to the fewest elite athletes at the lowest weight class.
One thing to note: it is impossible to visually determine which model fits better, even if it looks extremely obvious (e.g. fitting a 50th degree polynomial). The best way to select a model is to understand the real-world phenomena causing deviations from the mean (e.g. over-representation of children at super-low bodyweights). After that, a good rule of thumb is that if the R² values are similar, give preference to the model that under-fits, but this part is completely arbitrary.
The Formula
All units are in pounds. The formula result is the z-score. A score of 0 means average for the bodyweight.
For men:
Peidi Score = (Total - (3.3163 × Bodyweight + 503.01)) / 224For women:
Peidi Score = (Total - (1.5845 × Bodyweight + 405.48)) / 142Calculator and Percentile
Feel free to play around with the calculator below. It also calculates a rough percentile relative to the best performances of other drug-tested raw athletes.
Note: The percentile calculation uses the z-score and assumes a Gaussian distribution. The actual distribution is known to have fatter tails for both genders and a right skew for females.
Top 10 Powerlifters by Gender Using the Peidi Formula
Males
| Name | Peidi Score | Wilks | Wilks Rank (Men Only) | Bodyweight LB | Total LB |
|---|---|---|---|---|---|
| Jesse Norris | 3.42 | 586 | 2 | 197 | 2,015 |
| Dennis Cornelius | 3.12 | 564 | 5 | 262 | 2,157 |
| Krzysztof Wierzbicki | 3.00 | 549 | 8 | 220 | 1,985 |
| Hifon Smith | 2.81 | 544 | 14 | 263 | 2,082 |
| Bryce Lewis | 2.77 | 533 | 22 | 230 | 1,962 |
| Garrett Blevins | 2.73 | 530 | 25 | 230 | 1,952 |
| Brett Gibbs | 2.73 | 544 | 13 | 183 | 1,795 |
| Mikhaylo Bulanyy | 2.73 | 532 | 23 | 205 | 1,868 |
| John Haack | 2.72 | 543 | 15 | 183 | 1,792 |
| Ashton Rouska | 2.72 | 533 | 18 | 201 | 1,852 |
Females
| Name | Peidi Score | Wilks | Wilks Rank (Women Only) | Bodyweight LB | Total LB |
|---|---|---|---|---|---|
| Bonica Lough | 4.04 | 513 | 19 | 291 | 1,439 |
| Daniella Melo | 3.99 | 511 | 20 | 185 | 1,262 |
| Kimberly Walford | 3.83 | 550 | 3 | 148 | 1,182 |
| Ana Rosa Castellain | 3.69 | 530 | 10 | 153 | 1,171 |
| Sara Cowan | 3.52 | 485 | 51 | 184 | 1,196 |
| Ielja Strik | 3.41 | 479 | 69 | 184 | 1,179 |
| Jennifer Thompson | 3.41 | 548 | 4 | 135 | 1,101 |
| Isabella von Weissenberg | 3.37 | 505 | 25 | 156 | 1,130 |
| Amanda Lawrence | 3.33 | 476 | 79 | 181 | 1,163 |
| Evgenia Dukacheva | 3.31 | 474 | 83 | 182 | 1,163 |
Overall, the top 10 rankings with the new formula seem reasonable. Most of these top 10 athletes are known for being far ahead of their competition, which is what the formula set out to do. Personally, I always believed that Jesse Norris, who lifted more weight than the best competitor two weight classes higher, is the greatest powerlifter of all time, and he is #1 in the men’s rankings by a considerable margin.
There are some peculiarities in the rankings which I will address:
1. Elite Women Overwhelmingly Out-Score Elite Men
After examining the data in detail, I have to recommend comparing men’s scores and women’s scores separately. There is a large difference in standard deviation between men and women (251 vs. 142 respectively), suggesting different distributions that are not comparable. There are also minor yet statistically significant differences in kurtosis (a measure of peak height and tail size in the distribution) and skew (a fatter tail for top performers). These values are 0.56 and 0.32 respectively for females versus 0.47 and -0.04 for males respectively.
2. Over-representation among heavyweights, but not super-heavyweights, especially among women
I believe that this is fine and not an error with the model. Many scientific studies have shown that by far the best predictor of strength is muscle mass. Elite powerlifters with high muscle mass relative to bodyweight naturally gravitate toward heavier weight classes. If a lifter chooses not to, or can’t, put on more muscle and stays in a lower weight class, then their potential is limited and they will naturally be less impressive.
3. How is Daniella Melo ahead of Kimberly Walford in rankings?
She weighs 37 lb more and only lifted 80 lb more.
I believe that this is also not a problem with the model. If you look at the scatter plot of female totals by bodyweight, you’ll notice that females don’t gain much of a strength advantage from increased bodyweight. This falls in line with the scientific notion that women have far more difficulty putting on muscle without exogenous compounds compared to men. So a well-trained woman gaining additional weight will likely put on far more fat than muscle.
Comparing Some Non-Drug Tested Athletes Including Wraps
| Name | Peidi Score | Sex | Raw/Wraps | Wilks | BW LB | Total LB |
|---|---|---|---|---|---|---|
| Yury Belkin | 4.16 | M | Wraps | 629 | 220 | 2,276 |
| Stefanie Cohen | 4.09 | F | Wraps | 643 | 120 | 1,174 |
| Eric Lilliebridge | 3.74 | M | Wraps | 624 | 306 | 2,458 |
| Kevin Oak | 3.65 | M | Wraps | 594 | 220 | 2,151 |
| Ben Pollack | 3.50 | M | Wraps | 591 | 198 | 2,039 |
| Larry Williams | 3.47 | M | Raw | 592 | 277 | 2,293 |
| Eddie Hall* | 3.46 | M | 658 | 400 | 2,700 | |
| Pete Rubish | 3.19 | M | Raw | 562 | 240 | 2,100 |
| Rostislav Petkov | 3.17 | M | Wraps | 600 | 163 | 1,841 |
| Cailer Woolam | 3.15 | M | Raw | 561 | 212 | 1,996 |
Note: Total is a guestimate based on recent interviews. Eddie Hall has not recently competed in a powerlifting meet.